[CloudNeta] EKS 워크샵 스터디 (3) - EKS Scaling Part 2 - Pod 스케일링 (HPA, VPA, KEDA, CPA)
이번 게시글에서는 EKS 워크샵 스터디 제 3주차 내용을 작성합니다.
이 글은 3부로 나누어집니다.
Scaling Up 소개
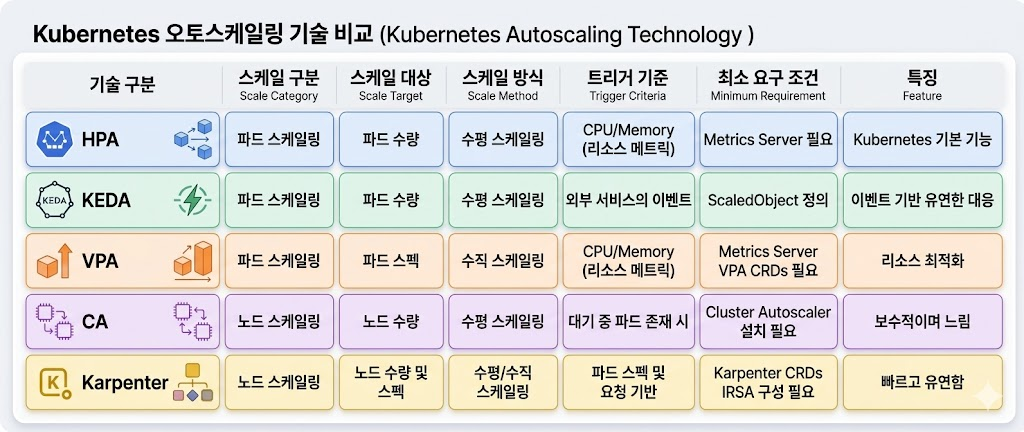
Kubernetes Patterns 2nd edition 에는 다양한 스케일 업 배포기법이 나옵니다.
- Application Tuning: 스레드, 힙, 기타요소로 프로세스를 튜닝하여 스케일을 업
- Vertical Pod Autoscaler(VPA): 파드에 할당되는 리소스를 추가/제거 하는 것
- Horizontal Pod Autoscaler(HPA): 파드 자체를 추가/제거 하는 것
- Cluster Autoscaler: 서버(노드)를 동적으로 추가/삭제하기 위한 하이버파이저 혹은 플랫폼 레벨에서 제어
AWS는 Cluster Autoscaler로 아래 요소를 제공합니다.
- Kapenter : Just-in-time Nodes for Any Kubernetes Cluster
- Fargate : Nodeless(Serverless) compute engine for containers
- AutoMode : AWS가 노드 1/2을 관리 하는 모드입니다.
이를 그림으로 도식화하면 아래와 같습니다(출처):
나에게 맞는 배포방안은 뭐지?
이를 생각하기 위해선, 설계중인 워크로드에 정말 초고속 반응형 스케일링이 필요한지 생각합니다. 필요한 방법이라면 어떻게든 도입해야하지만, 그렇지않으면 고스란히 기술부채입니다. 대부분의 워크로드에서는 아래 접근법 2-4가 더 비용효율적 입니다.
| 접근법 | 핵심 전략 | E2E 스케일링 시간 | 월 추가 비용 (28개 클러스터) | 복잡도 | 적합한 워크로드 |
|---|---|---|---|---|---|
| 1. 반응형 고속화 | Karpenter + KEDA + Warm Pool | 5-45초 | $40K-190K | 매우 높음 | 극소수 미션 크리티컬 |
| 2. 예측형 스케일링 | CronHPA + Predictive Scaling | 사전 확장 (0초) | $2K-5K | 낮음 | 패턴 있는 대부분의 서비스 |
| 3. 아키텍처 복원력 | SQS/Kafka + Circuit Breaker | 스케일링 지연 허용 | $1K-3K | 중간 | 비동기 처리 가능한 서비스 |
| 4. 적정 기본 용량 | 기본 replica 20-30% 증설 | 불필요 (이미 충분) | $5K-15K | 매우 낮음 | 안정적인 트래픽 |
graph TB
    START[트래픽 급증 시
사용자 에러 발생] --> Q1{트래픽 패턴이
예측 가능한가?}

    Q1 -->|Yes| PRED[접근법 2: 예측형 스케일링
CronHPA + Predictive Scaling]
    Q1 -->|No| Q2{요청을 즉시
처리해야 하는가?}

    Q2 -->|대기 가능| ARCH[접근법 3: 아키텍처적 복원력
큐 기반 버퍼링 + Rate Limiting]
    Q2 -->|즉시 처리 필수| Q3{기본 용량을
늘릴 수 있는가?}

    Q3 -->|Yes| BASE[접근법 4: 적정 기본 용량
피크 70-80%로 기본 운영]
    Q3 -->|비용 제약| REACTIVE[접근법 1: 반응형 스케일링 고속화
Karpenter + KEDA + Warm Pool]

    PRED --> COMBINE[실무: 2-3개 접근법 조합 적용]
    ARCH --> COMBINE
    BASE --> COMBINE
    REACTIVE --> COMBINE

    style PRED fill:#059669,stroke:#232f3e,stroke-width:2px
    style ARCH fill:#3b82f6,stroke:#232f3e,stroke-width:2px
    style BASE fill:#8b5cf6,stroke:#232f3e,stroke-width:2px
    style REACTIVE fill:#f59e0b,stroke:#232f3e,stroke-width:2px
    style COMBINE fill:#1f2937,color:#fff,stroke:#232f3e,stroke-width:2px
살펴보기 - EKS Best Practices Guide
Cluster Autoscaling - Karpenter
Scalability - Kubernetes Scaling Theory
Scalability - Node and Workload Efficiency
HPA - Horizontal Pod Autoscaler
- Kubernetes에서 애플리케이션의 Pod 복제본 수를 확장하는 것을 수평 Pod 자동 확장이라고 합니다.
- 수평적이기 때문에 트래픽 증가를 위해 복제본 수를 늘리것이고, 수직적은 복제본에서 사용할 수 있는 리소스를 늘리는 것을 의미합니다.
- 일반적으로 시스템을 확장하려면 수평 스케일링을 사용해야 합니다.
- Kubernetes에는 수평 포드 오토스케일러(HPA)라는 기능이 포함되어 있습니다. 이 시스템은 CPU 사용량과 같은 포드 메트릭을 관찰하고 대상으로 지정할 수 있으며, 일부 스케일링 제한(최소 및 최대 복제본)도 포함되어 있습니다.
- 그런 다음 HPA는 포드를 생성하고 제거하여 사용자의 메트릭을 충족하려고 시도합니다.
- CPU의 경우, 예를 들어 20%의 CPU 사용률을 목표로 하는 경우, HPA는 평균 사용량(모든 포드에서)이 20%를 초과할 때 복제본을 추가하고(팟이 리소스 요청에서 요청한 것의) 20% 이하로 떨어지면 복제본을 제거합니다.
- 이러한 행동은 사용자가 제공하는 최소 및 최대 한도와 너무 많은 이탈을 피하기 위한 재사용 대기 시간의 영향을 받습니다.
HPA란?
실습
실습 앱을 배포해서 확인해봅니다.
php-apache 앱 배포해보기
php-apache 앱이란?
쿠버네티스 테스트에 사용되는 앱입니다.
해당 앱은 단순히 아래 로직을 구동하는 컨테이너를 배포하는 것에 불과합니다.
<?php
$x = 0.0001;
for ($i = 0; $i <= 1000000; $i++) {
			$x += sqrt($x);
}
echo "OK!";
?>
아래와 같이 배포하고, 잘 동작하나 확인해봅시다.
apiVersion: apps/v1
kind: Deployment
metadata:
  name: php-apache
spec:
  selector:
    matchLabels:
      run: php-apache
  template:
    metadata:
      labels:
        run: php-apache
    spec:
      containers:
      - name: php-apache
        image: registry.k8s.io/hpa-example
        ports:
        - containerPort: 80
        resources:
          limits:
            cpu: 500m
          requests:
            cpu: 200m
---
apiVersion: v1
kind: Service
metadata:
  name: php-apache
  labels:
    run: php-apache
spec:
  ports:
  - port: 80
  selector:
    run: php-apache
# 배포해보고
$ k apply -f hpa-test.yaml
deployment.apps/php-apache created
service/php-apache created

# 잘 나온지도 봅니다.
$ k exec -ti deploy/php-apache -- cat /var/www/html/index.php
<?php
$x = 0.0001;
for ($i = 0; $i <= 1000000; $i++) {
        $x += sqrt($x);
}
echo "OK!";
?>
cURL 파드를 배포하고, 부하를 발생해서 CPU가 증가하는지 살펴봅시다.
cat <<EOF | kubectl apply -f -
apiVersion: v1
kind: Pod
metadata:
  name: curl
spec:
  containers:
  - name: curl
    image: curlimages/curl:latest
    command: ["sleep", "3600"]
  restartPolicy: Never
EOF

# 단발성으로 테스트하면?
$ kubectl exec -it curl -- curl php-apache

# 순간적으로 튀는 게 보입니다
➜ k exec -ti deploy/php-apache -- top
top - 06:03:36 up 14:58,  0 users,  load average: 0.44, 0.21, 0.13
Tasks:   7 total,   1 running,   6 sleeping,   0 stopped,   0 zombie
%Cpu(s):  4.3 us,  0.7 sy,  0.0 ni, 94.8 id,  0.0 wa,  0.0 hi,  0.0 si,  0.2 st
KiB Mem:   3926448 total,  3666240 used,   260208 free,      844 buffers
KiB Swap:        0 total,        0 used,        0 free.  2714120 cached Mem

    PID USER      PR  NI    VIRT    RES    SHR S  %CPU %MEM     TIME+ COMMAND
     10 www-data  20   0  166348  10824   5472 S   2.7  0.3   0:00.08 apache2
      1 root      20   0  166268  19132  13860 S   0.0  0.5   0:00.09 apache2
      9 www-data  20   0  166348  10824   5472 S   0.0  0.3   0:00.08 apache2
     11 www-data  20   0  166292   7456   2172 S   0.0  0.2   0:00.00 apache2
     12 www-data  20   0  166292   7456   2172 S   0.0  0.2   0:00.00 apache2
     13 www-data  20   0  166292   7456   2172 S   0.0  0.2   0:00.00 apache2
     20 root      20   0   21920   2464   2068 R   0.0  0.1   0:00.05 top

# 그러면 이제 여러 워커로 동시에 호출해보죠
$ kubectl exec -it curl -- sh -c '
for i in $(seq 1 5); do
  while true; do curl -s php-apache & sleep 1; done &
done
wait'

# 많이 발생해서 부하가 올라가는 건 보입니다.
top - 06:05:14 up 15:00,  0 users,  load average: 9.78, 2.75, 0.99
Tasks: 152 total, 151 running,   1 sleeping,   0 stopped,   0 zombie
%Cpu(s): 33.8 us,  0.8 sy,  0.0 ni, 65.2 id,  0.0 wa,  0.0 hi,  0.1 si,  0.0 st
KiB Mem:   3926448 total,  3807496 used,   118952 free,      844 buffers
KiB Swap:        0 total,        0 used,        0 free.  2714140 cached Mem

    PID USER      PR  NI    VIRT    RES    SHR S  %CPU %MEM     TIME+ COMMAND
    118 www-data  20   0  166324  10584   5248 R   1.0  0.3   0:00.12 apache2
...
    121 www-data  20   0  166324  10584   5248 R   0.5  0.3   0:00.06 apache2
    123 www-data  20   0  166324  10584   5248 R   0.5  0.3   0:00.05 apache2
HPA 정책 생성 후 테스트해보기
HorizontalPodAutoscaler) 생성하기
apiVersion: autoscaling/v2
kind: HorizontalPodAutoscaler
metadata:
  name: php-apache
spec:
  scaleTargetRef:
    apiVersion: apps/v1
    kind: Deployment
    name: php-apache
  # min-max가 1-10개고
  minReplicas: 1
  maxReplicas: 10
  metrics:
  # 리소스를 살펴볼텐데, 평균 utilization이 50을 넘기면 scale out을 하겠다는 것이군요
  - type: Resource
    resource:
      name: cpu
      target:
        averageUtilization: 50
        type: Utilization
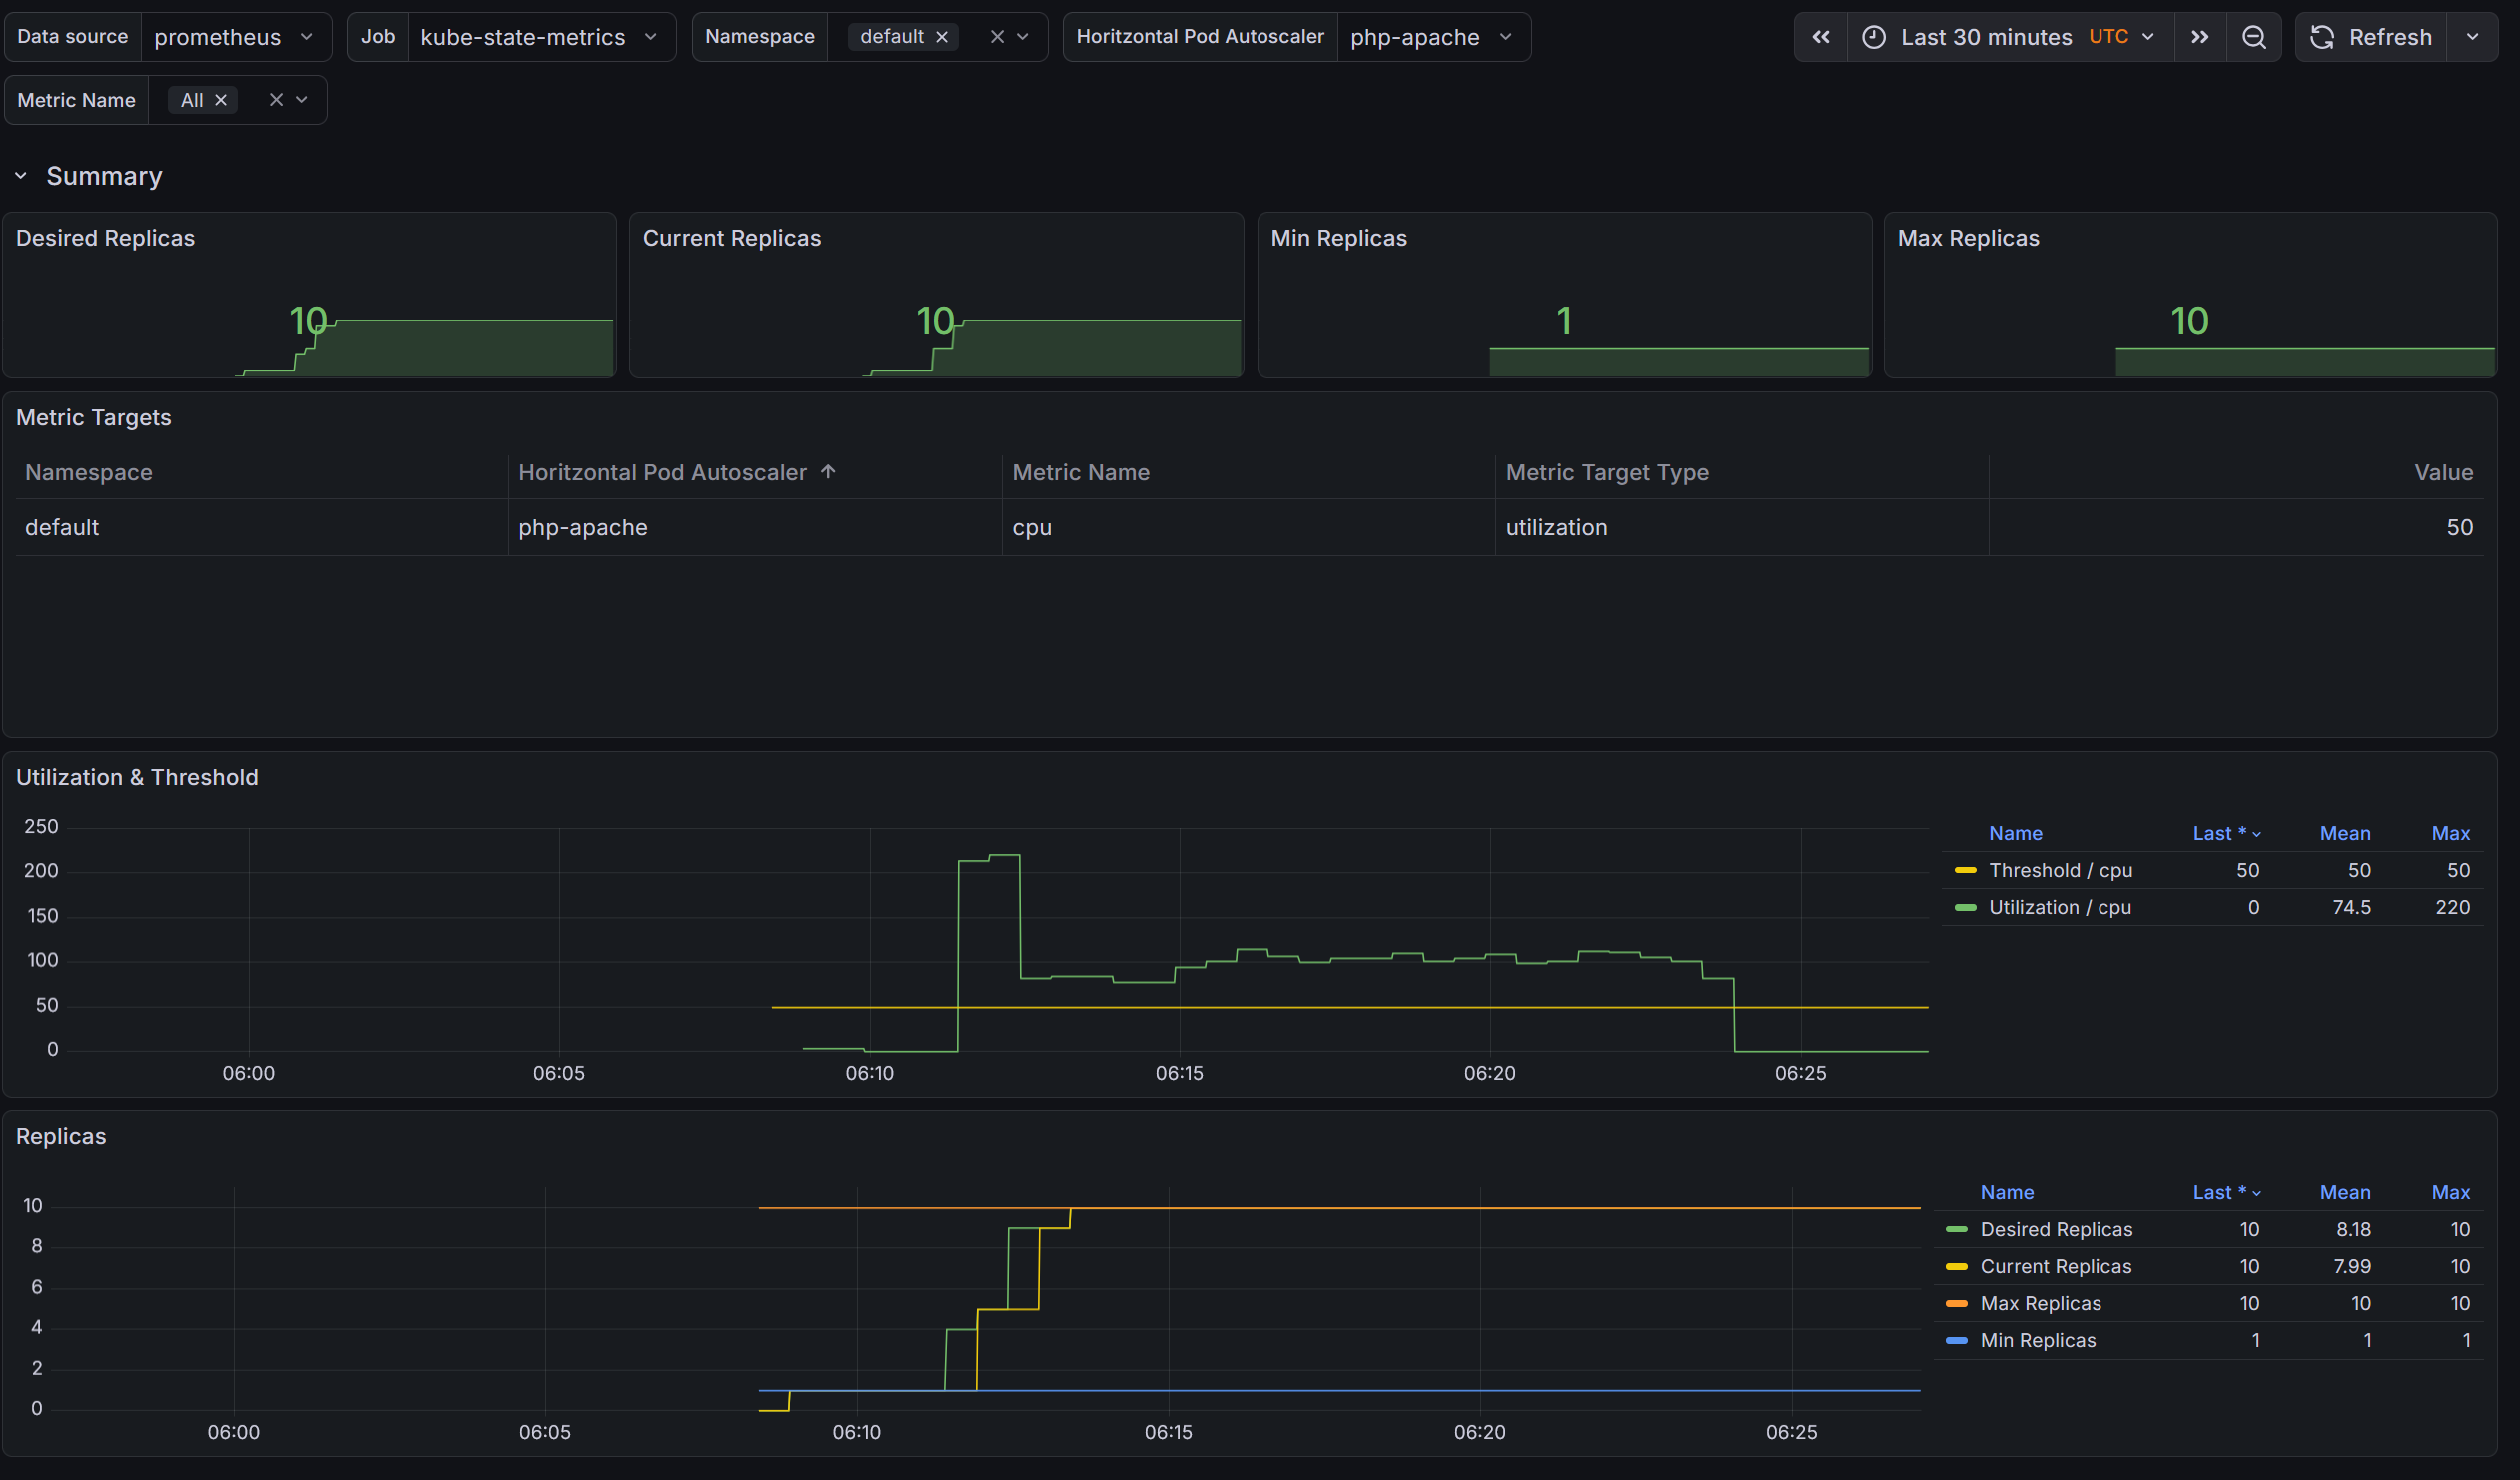
아래와 같이 생성 후 hpa를 확인해봅시다.
$ k apply -f hpa-policy.yaml
horizontalpodautoscaler.autoscaling/php-apache created
$ k describe hpa
Name: php-apache
Namespace: default
Labels: <none>
Annotations: <none>
CreationTimestamp: Thu, 02 Apr 2026 15:08:11 +0900
Reference: Deployment/php-apache
Metrics: ( current / target )
resource cpu on pods (as a percentage of request): 3% (6m) / 50%
Min replicas: 1
Max replicas: 10
Deployment pods: 1 current / 1 desired
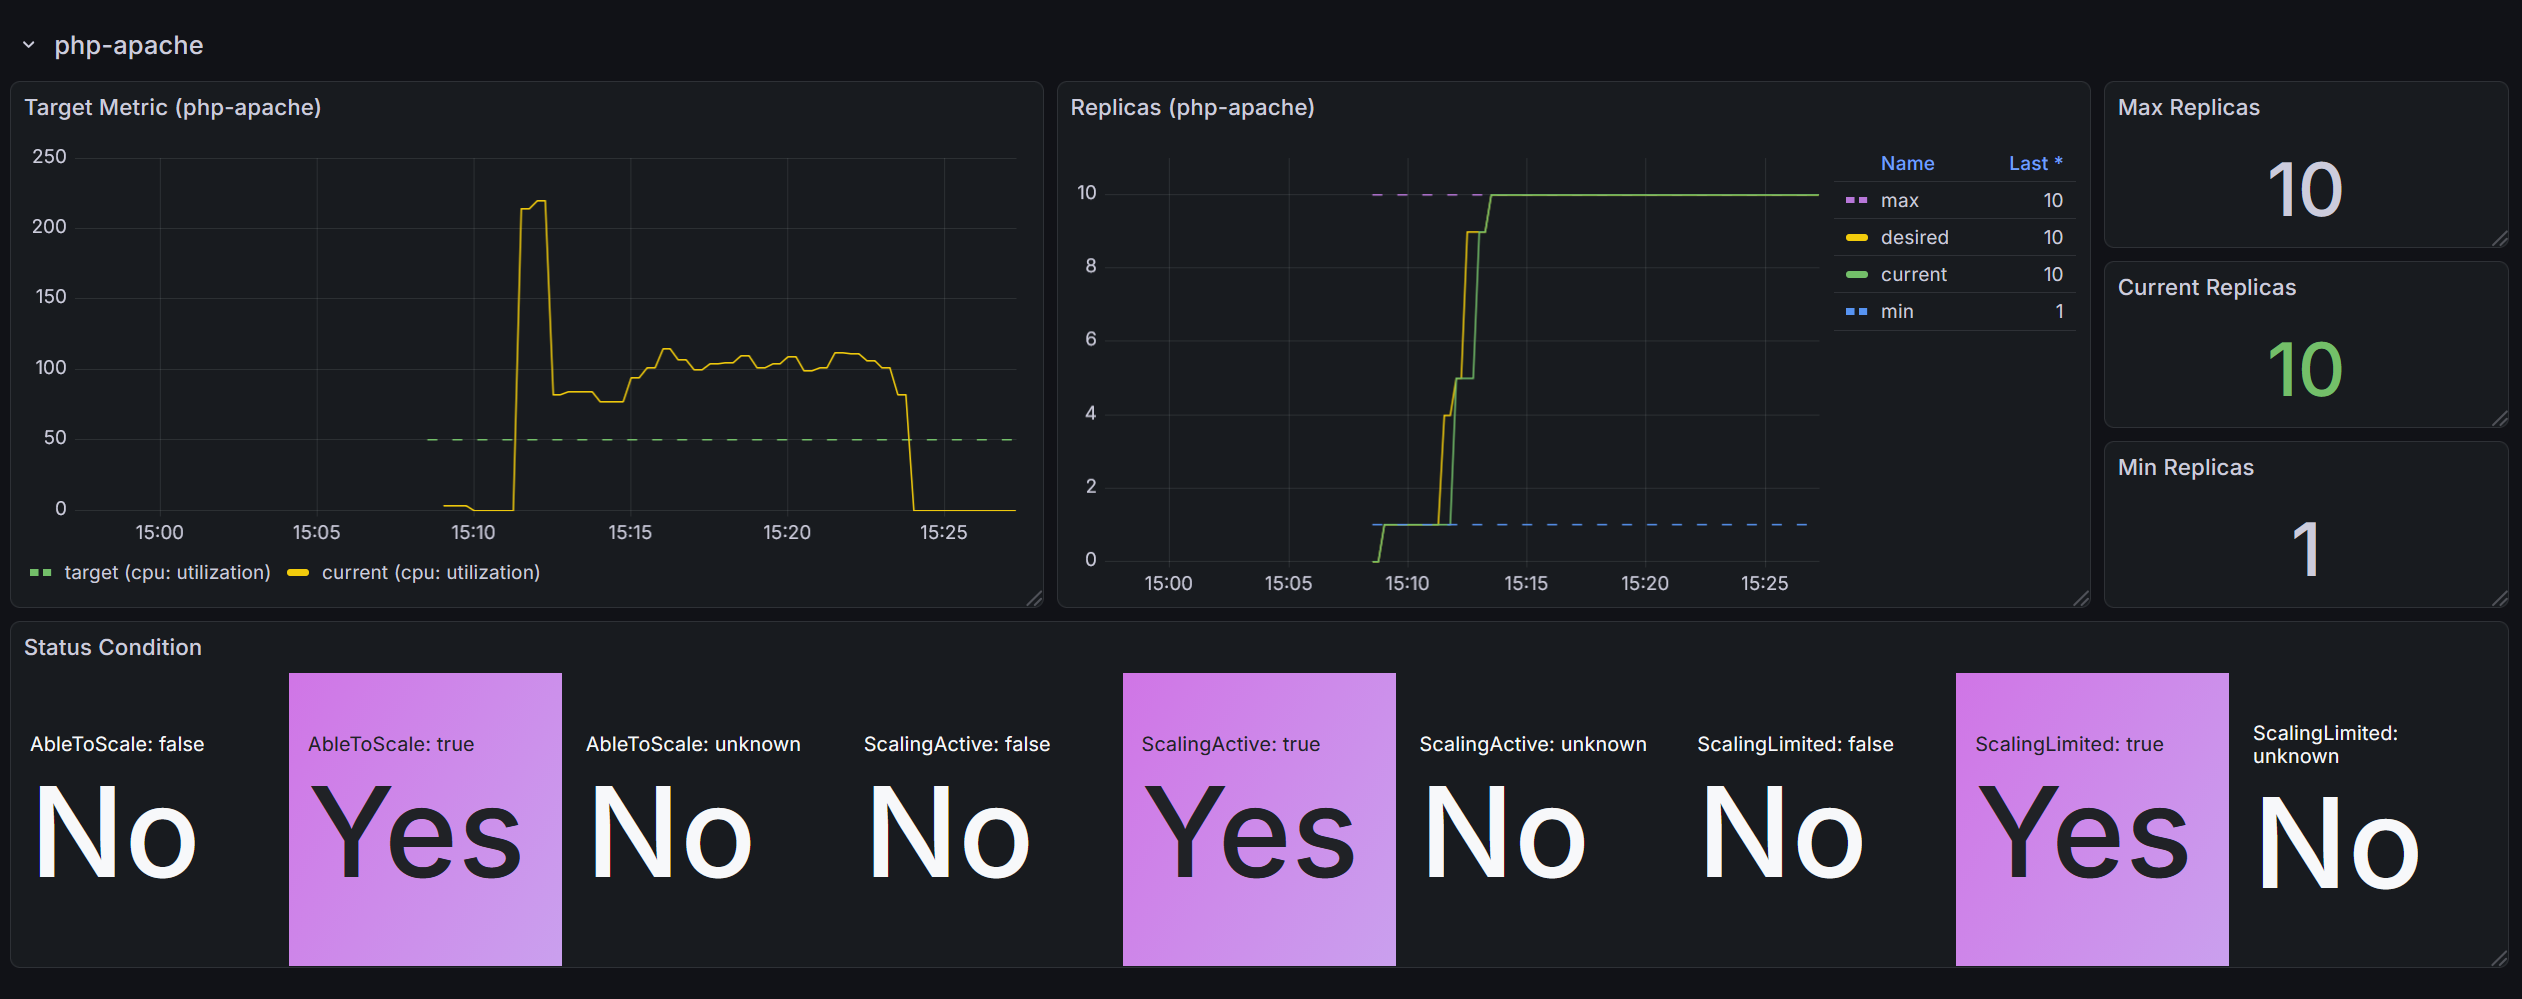
Conditions:
Type Status Reason Message
---- ------ ------ -------
AbleToScale True ReadyForNewScale recommended size matches current size
ScalingActive True ValidMetricFound the HPA was able to successfully calculate a replica count from cpu resource utilization (percentage of request)
ScalingLimited False DesiredWithinRange the desired count is within the acceptable range
Events: <none>
이후 테스트를 위해 부하를 줘봅시다:
$ k exec curl -- sh -c 'while true; do curl -s php-apache; sleep 0.01; done'

# 파드도 성공적으로 늘어나있군요
$ k get pods
NAME                          READY   STATUS    RESTARTS   AGE
awscli-pod-847bcdb4db-b76p2   1/1     Running   0          12h
awscli-pod-847bcdb4db-htkws   1/1     Running   0          12h
curl                          1/1     Running   0          16m
php-apache-7ff755b4cb-2hjt6   1/1     Running   0          2m41s
php-apache-7ff755b4cb-cxdft   1/1     Running   0          3m41s
php-apache-7ff755b4cb-jb5ph   1/1     Running   0          3m41s
php-apache-7ff755b4cb-mqv8x   1/1     Running   0          2m41s
php-apache-7ff755b4cb-nzfl5   1/1     Running   0          20m
php-apache-7ff755b4cb-qw5zq   1/1     Running   0          3m27s
php-apache-7ff755b4cb-rdfcp   1/1     Running   0          116s
php-apache-7ff755b4cb-wmzdn   1/1     Running   0          3m41s
php-apache-7ff755b4cb-xlssp   1/1     Running   0          2m41s
php-apache-7ff755b4cb-z8v2d   1/1     Running   0          2m41s

# 오른것도, 내려간것도 확인완료입니다.
Events:
  Type    Reason             Age    From                       Message
  ----    ------             ----   ----                       -------
  Normal  SuccessfulRescale  17m   horizontal-pod-autoscaler  New size: 4; reason: cpu resource utilization (percentage of request) above target
  Normal  SuccessfulRescale  17m   horizontal-pod-autoscaler  New size: 5; reason: cpu resource utilization (percentage of request) above target
  Normal  SuccessfulRescale  16m   horizontal-pod-autoscaler  New size: 9; reason: cpu resource utilization (percentage of request) above target
  Normal  SuccessfulRescale  15m   horizontal-pod-autoscaler  New size: 10; reason: cpu resource utilization (percentage of request) above target
  Normal  SuccessfulRescale  16s   horizontal-pod-autoscaler  New size: 2; reason: All metrics below target
  Normal  SuccessfulRescale  1s    horizontal-pod-autoscaler  New size: 1; reason: All metrics below target
HPA의 주요 제약사항
- 평균의 함정: 특정 파드만 100% 시 probe 실패 후 restart 발생
→ 나머지 파드 부하 후 반복
⇒ 다수 파드 종료로 과도한 증설 발생, 기간 동안 장애가 일어날 수 있습니다. - 증설까지의 시간: 스파이크성 트래픽에는 대응이 어렵습니다
- 파드 App 초기화 동작 시 CPU/Mem 튀는 현상에도 대응이 필요합니다 ⇒ Kube Startup CPU Boost 기법 활용 가능!
Google에서 만든 오픈소스 컨트롤러로, Pod 시작 시에만 CPU request/limit을 일시적으로 높여주고, 시작이 완료되면 원래 값으로 되돌리는 기능입니다.

JVM 기반 앱은 시작 시 클래스 로딩, JIT 컴파일 등으로 CPU를 평소보다 훨씬 많이 사용하지만, 정상 구동 후에는 적게 사용합니다. 이런 시작/정상 상태 간 CPU 사용량 차이가 큰 워크로드에 적합합니다.
Kubernetes 1.27에 도입된 In-place Pod Resize 기능을 활용하여, Pod를 재시작하지 않고 리소스를 변경합니다.
VPA - Vertical Pod Autoscaler
VPA에 대해 알아봅시다.
VPA란?
pod resources.request을 최대한 최적값으로 수정합니다 ⇒ 악분님 블로그에서 기본 소개
- VPA와 HPA를 같은 메트릭(예: 둘 다 CPU)으로 동시에 사용하면 충돌합니다. 메트릭을 분리하거나 VPA를 Off 모드로 두면 공존 가능합니다. (아래 공존 전략 참고)
- VPA는 pod자원을 최적값으로 수정하기 위해 pod를 재실행(기존 pod를 종료하고 새로운 pod실행)합니다.
- 계산 방식 : ‘기준값(파드가 동작하는데 필요한 최소한의 값)’ 결정 → ‘마진(약간의 적절한 버퍼)’ 추가 → 상세정리 Link
HPA vs VPA 비교
HPA는 Pod 수를 늘리고(수평), VPA는 Pod 리소스 크기(CPU/Memory request/limit)를 키웁니다(수직).
| HPA | VPA | |
|---|---|---|
| 확장 방향 | 수평 — Pod 수 증감 | 수직 — Pod 리소스 크기 증감 |
| 예시 | 1 Pod(1 CPU) → 3 Pod(1 CPU씩) | 1 Pod(1 CPU) → 1 Pod(2 CPU) |
| Pod 재시작 | 없음 (새 Pod 추가) | 있음 (Pod Evict 후 새로 생성, 다운타임 발생) |
| 적합한 워크로드 | Stateless 웹 서비스 | 리소스 요구량이 가변적인 앱 |
VPA 제한사항과 주의점
| 제한사항 | 설명 | 대응 |
|---|---|---|
| Pod 재시작 필요 | 실행 중인 Pod의 리소스를 in-place 변경 불가. Evict 후 재생성 | PodDisruptionBudget 설정 필수 |
| JVM 힙 사이즈 불일치 | JAVA_OPTS에 힙 크기를 고정하면 VPA가 메모리를 변경해도 JVM은 기존 힙 사용 → 리소스 낭비 |
힙 크기를 비율(%)로 설정하거나 동적으로 계산 |
| StatefulSet 주의 | 순차적 재시작으로 데이터 손실 위험 | Initial 모드만 사용 권장 |
| Metrics Server 의존 | Metrics Server 장애 시 권장사항 업데이트 중단 | Metrics Server HA 구성 |
| 권장사항 계산 시간 | 최소 24시간 데이터 필요. 트래픽 패턴 변화 반영에 시간 소요 | 충분한 관찰 기간 확보 |
VPA와 HPA 공존 전략
VPA와 HPA를 동일 메트릭(CPU 등)으로 동시에 사용하면 충돌이 발생합니다. 공존이 필요한 경우 아래 패턴을 사용합니다.
| 패턴 | 구성 | 설명 |
|---|---|---|
| 패턴 1 (권장) | VPA Off + HPA | VPA는 권장사항 조회 용도로만, 실제 스케일링은 HPA |
| 패턴 2 (권장) | VPA Memory + HPA CPU | 메트릭을 분리하여 충돌 방지 |
| 패턴 3 (고급) | VPA + HPA + Custom Metrics | 큐 기반 워크로드 등 특수한 경우 |
Kubernetes 1.35(2025.12)에서 GA가 되었습니다. Pod를 재시작하지 않고 CPU/Memory request/limit을 변경할 수 있어, VPA의 가장 큰 단점인 Pod 재시작 문제가 해결됩니다. VPA도 이를 활용하는 InPlaceOrRecreate 업데이트 모드가 beta로 제공되고 있습니다.
참고:
참고사항 - KRR
KRR: Prometheus-based Kubernetes Resource Recommendations - 링크 & Youtube - 링크 ⇒ Krr을 통한 최적화 작업 경험 - Blog- KRR(Kubernetes Resource Recommender)을 사용하면 실제 사용량 기준으로 Request와 Limit 사용량을 추천
- 이 요소를 이용해서 관리를 용이하게 하시는 것을 추천드립니다.
- Difference with Kubernetes VPA
| Feature 🛠️ | Robusta KRR 🚀 | Kubernetes VPA 🌐 |
|---|---|---|
| Resource Recommendations 💡 | ✅ CPU/Memory requests and limits | ✅ CPU/Memory requests and limits |
| Installation Location 🌍 | ✅ Not required to be installed inside the cluster, can be used on your own device, connected to a cluster | ❌ Must be installed inside the cluster |
| Workload Configuration 🔧 | ✅ No need to configure a VPA object for each workload | ❌ Requires VPA object configuration for each workload |
| Immediate Results ⚡ | ✅ Gets results immediately (given Prometheus is running) | ❌ Requires time to gather data and provide recommendations |
| Reporting 📊 | ✅ Detailed CLI Report, web UI in Robusta.dev | ❌ Not supported |
| Extensibility 🔧 | ✅ Add your own strategies with few lines of Python | ⚠️ Limited extensibility |
| Custom Metrics 📏 | 🔄 Support in future versions | ❌ Not supported |
| Custom Resources 🎛️ | 🔄 Support in future versions (e.g., GPU) | ❌ Not supported |
| Explainability 📖 | 🔄 Support in future versions (Robusta will send you additional graphs) | ❌ Not supported |
| Autoscaling 🔀 | 🔄 Support in future versions | ✅ Automatic application of recommendations |
KEDA - Kubernetes Event-driven Autoscaling
- 기존의 HPA(Horizontal Pod Autoscaler)는 리소스(CPU, Memory) 메트릭을 기반으로 스케일 여부를 결정하게 됩니다.
- 반면에 KEDA는 특정 이벤트를 기반으로 스케일 여부를 결정할 수 있습니다.
- 예를 들어 airflow는 metadb를 통해 현재 실행 중이거나 대기 중인 task가 얼마나 존재하는지 알 수 있습니다.
- 이러한 이벤트를 활용하여 worker의 scale을 결정한다면 queue에 task가 많이 추가되는 시점에 더 빠르게 확장할 수 있습니다.
KEDA란?
KEDA(Kubernetes Event-Driven Autoscaling)는 CNCF 졸업 프로젝트로, HPA를 대체하는 게 아니라 확장합니다. KEDA가 외부 이벤트 소스에서 메트릭을 가져와 Kubernetes Metrics API로 노출하면, 그 뒤는 기존 HPA가 스케일링을 수행합니다.
동작 흐름
flowchart TD
    A[ScaledObject 생성] --> B[Admission Webhook 검증]
    B --> C[KEDA가 자동으로 HPA 리소스 생성]
    C --> D[HPA가 KEDA Metrics Server를 참조]
    D --> E[KEDA Metrics Server가\n외부 이벤트 소스에서 메트릭 수집]
    E --> F{이벤트 존재?}
    F -- Yes --> G[HPA가 메트릭 기반으로\nPod 스케일 아웃]
    F -- No --> H[keda-operator가\nreplicas=0으로 스케일 다운]
    H -- 이벤트 재발생 --> I[keda-operator가\nreplicas=1로 활성화]
    I --> D

    style A fill:#4a9eff,color:#fff
    style F fill:#ffb347,color:#000
    style G fill:#77dd77,color:#000
style H fill:#ff6b6b,color:#fff3개 컴포넌트
KEDA를 설치하면 3개의 컴포넌트가 배포됩니다.
kubectl get pod -n keda
NAME                                               READY   STATUS    RESTARTS      AGE
keda-operator-6bdffdc78-5rqnp                      1/1     Running   1 (11m ago)   11m
keda-operator-metrics-apiserver-74d844d769-2vrcq   1/1     Running   0             11m
keda-admission-webhooks-86cffccbf5-kmb7v           1/1     Running   0             11m
| 컴포넌트 | 역할 |
|---|---|
keda-operator |
Deployment를 감시하며 이벤트가 없으면 0으로 스케일 다운, 이벤트가 발생하면 활성화 |
keda-operator-metrics-apiserver |
외부 이벤트 데이터(큐 길이, 스트림 lag 등)를 Kubernetes Metrics API로 노출 → HPA가 이 메트릭을 기반으로 스케일링 |
keda-admission-webhooks |
리소스 변경을 검증하여 잘못된 설정 방지 (예: 같은 대상에 ScaledObject 중복 생성 차단) |
ScaledObject — KEDA의 핵심 리소스
ScaledObject는 "어떤 Deployment를, 어떤 이벤트 소스 기준으로, 몇 개까지 스케일할 것인가"를 정의하는 CRD입니다.
apiVersion: keda.sh/v1alpha1
kind: ScaledObject
metadata:
  name: my-app-scaledobject
spec:
  scaleTargetRef:
    name: my-app-deployment # 스케일링 대상 Deployment
  minReplicaCount: 0 # 이벤트 없으면 0까지 축소 가능
  maxReplicaCount: 10
  triggers: # 이벤트 소스 (복수 가능)
    - type: <scaler-type>
      metadata: ...
70개 이상의 Scaler 지원
KEDA의 핵심은 Scaler(트리거)입니다. 70개 이상의 이벤트 소스를 지원하며, 클라우드 벤더에 종속되지 않습니다.
| 카테고리 | 예시 |
|---|---|
| 메시지 큐 | Apache Kafka, RabbitMQ, AWS SQS, Azure Service Bus, NATS |
| 클라우드 | AWS CloudWatch/DynamoDB/Kinesis, Azure Event Hubs, GCP Pub/Sub |
| 데이터베이스 | PostgreSQL, MySQL, MongoDB, Redis |
| 모니터링 | Prometheus, Datadog, New Relic |
| 스케줄 | Cron |
| 기타 | HTTP request rate, Kubernetes 리소스, 외부 API |
Scaler 예시 (1) — Kafka topic lag
Kafka consumer group의 lag을 기준으로 스케일링합니다.
triggers:
  - type: kafka
    metadata:
      bootstrapServers: kafka.svc:9092
      consumerGroup: my-group
      topic: test-topic
      lagThreshold: "5" # lag이 평균 5 이상이면 스케일 아웃
      activationLagThreshold: "3" # lag이 3 이상이면 스케일러 활성화
      offsetResetPolicy: latest
Scaler 예시 (2) — AWS SQS 큐 길이
SQS 큐에 쌓인 메시지 수를 기준으로 스케일링합니다. EKS 환경에서 가장 흔한 패턴 중 하나입니다.
apiVersion: keda.sh/v1alpha1
kind: ScaledObject
metadata:
  name: aws-sqs-queue-scaledobject
spec:
  scaleTargetRef:
    name: my-worker
  minReplicaCount: 0 # 큐가 비면 0으로
  maxReplicaCount: 10
  triggers:
    - type: aws-sqs-queue
      authenticationRef:
        name: keda-trigger-auth-aws-credentials
      metadata:
        queueURL: https://sqs.ap-northeast-2.amazonaws.com/123456789012/my-queue
        queueLength: "5" # 메시지 5개당 Pod 1개
        awsRegion: ap-northeast-2
        identityOwner: operator # EKS 노드 IAM 역할 사용
identityOwner: operator 사용 시 노드의 IAM 역할에 sqs:GetQueueAttributes 권한이 필요합니다. 별도 인증이 필요하면 TriggerAuthentication을 사용합니다.
apiVersion: keda.sh/v1alpha1
kind: TriggerAuthentication
metadata:
  name: keda-trigger-auth-aws-credentials
spec:
  secretTargetRef:
    - parameter: awsAccessKeyID
      name: aws-secret
      key: AWS_ACCESS_KEY_ID
    - parameter: awsSecretAccessKey
      name: aws-secret
      key: AWS_SECRET_ACCESS_KEY
Scaler 예시 (3) — Cron 스케줄 기반
업무 시간에만 Pod를 띄우고, 야간/주말에는 0으로 내리는 비용 절감 패턴입니다. - Cron Scaler 문서
apiVersion: keda.sh/v1alpha1
kind: ScaledObject
metadata:
  name: office-hours-scaledobject
spec:
  scaleTargetRef:
    name: my-app-deployment
  minReplicaCount: 0
  maxReplicaCount: 5
  triggers:
    - type: cron
      metadata:
        timezone: Asia/Seoul
        start: 0 9 * * MON-FRI # 평일 09:00 시작
        end: 0 18 * * MON-FRI # 평일 18:00 종료
        desiredReplicas: "3" # 업무 시간에는 3개 유지
Cron과 CPU 트리거를 조합하면 더 유연해집니다. 업무 시간에는 최소 1개를 보장하되, 부하에 따라 추가 확장합니다.
triggers:
  - type: cron
    metadata:
      timezone: Asia/Seoul
      start: 0 9 * * MON-FRI
      end: 0 18 * * MON-FRI
      desiredReplicas: "1"
  - type: cpu
    metadata:
      value: "80"
- CPU/Memory 기반 스케일링이면 → HPA로 충분
- 큐 길이, 스트림 lag, cron 스케줄, DB 쿼리 결과 등 외부 이벤트 기반이면 → KEDA
- KEDA는 0 → 1 스케일링(scale-to-zero)이 가능하다는 점도 HPA와의 차이
- Node 오토스케일링(CAS/Karpenter)과 조합하면, Pod가 0 → N으로 늘어날 때 노드도 자동 확장되어 비용 최적화 가능
실습
특정 이벤트 기반의 파드 오토 스케일링을 테스트 해봅시다. 먼저 KEDA 대시보드 JSON을 다운로드 받고 import 합시다.
이어서 설치 전, 기본 메트릭 서버에서 제공하는 API를 확인합니다.
$ k get --raw "/apis/metrics.k8s.io" -v=6 | jq
I0402 16:20:12.552961  519022 cmd.go:527] kubectl command headers turned on
I0402 16:20:12.615132  519022 loader.go:402] Config loaded from file:  /home/l4in/.kube/config
I0402 16:20:12.615328  519022 envvar.go:172] "Feature gate default state" feature="InOrderInformers" enabled=true
I0402 16:20:12.615359  519022 envvar.go:172] "Feature gate default state" feature="InformerResourceVersion" enabled=false
I0402 16:20:12.615388  519022 envvar.go:172] "Feature gate default state" feature="WatchListClient" enabled=false
I0402 16:20:12.615414  519022 envvar.go:172] "Feature gate default state" feature="ClientsAllowCBOR" enabled=false
I0402 16:20:12.615439  519022 envvar.go:172] "Feature gate default state" feature="ClientsPreferCBOR" enabled=false
I0402 16:20:13.302832  519022 round_trippers.go:632] "Response" verb="GET" url="https://A17A8A7F84B06E0B18298D9D26F3D875.sk1.ap-northeast-2.eks.amazonaws.com/apis/metrics.k8s.io" status="200 OK" milliseconds=687
{
  "kind": "APIGroup",
  "apiVersion": "v1",
  "name": "metrics.k8s.io",
  "versions": [
    {
      "groupVersion": "metrics.k8s.io/v1beta1",
      "version": "v1beta1"
    }
  ],
  "preferredVersion": {
    "groupVersion": "metrics.k8s.io/v1beta1",
    "version": "v1beta1"
  }
}
KEDA 구성하기
KEDA를 설치하고, 아래와 같은 value를 포함하여 helm chart로 프로비저닝 해봅시다.
KEDA 설치 - 서비스 모니터 설정
metricsServer:
  useHostNetwork: true

prometheus:
  metricServer:
    enabled: true
    port: 9022
    portName: metrics
    path: /metrics
    serviceMonitor:
      # Enables ServiceMonitor creation for the Prometheus Operator
      enabled: true
  operator:
    enabled: true
    port: 8080
    serviceMonitor:
      # Enables ServiceMonitor creation for the Prometheus Operator
      enabled: true
  webhooks:
    enabled: true
    port: 8020
    serviceMonitor:
      # Enables ServiceMonitor creation for the Prometheus webhooks
      enabled: true
$ helm repo add kedacore https://kedacore.github.io/charts
"kedacore" has been added to your repositories

$ helm repo update
Hang tight while we grab the latest from your chart repositories...
...Successfully got an update from the "kedacore" chart repository
...Successfully got an update from the "eks" chart repository
...Successfully got an update from the "prometheus-community" chart repository
...Successfully got an update from the "geek-cookbook" chart repository
Update Complete. ⎈Happy Helming!⎈

$ helm install keda kedacore/keda --version 2.16.0 --namespace keda --create-namespace -f keda-values.yaml
NAME: keda
LAST DEPLOYED: Thu Apr  2 16:31:24 2026
NAMESPACE: keda
STATUS: deployed
REVISION: 1
DESCRIPTION: Install complete
TEST SUITE: None
NOTES:
:::^.     .::::^:     :::::::::::::::    .:::::::::.                   .^.
7???~   .^7????~.     7??????????????.   :?????????77!^.              .7?7.
7???~  ^7???7~.       ~!!!!!!!!!!!!!!.   :????!!!!7????7~.           .7???7.
7???~^7????~.                            :????:    :~7???7.         :7?????7.
7???7????!.           ::::::::::::.      :????:      .7???!        :7??77???7.
7????????7:           7???????????~      :????:       :????:      :???7?5????7.
7????!~????^          !77777777777^      :????:       :????:     ^???7?#P7????7.
7???~  ^????~                            :????:      :7???!     ^???7J#@J7?????7.
7???~   :7???!.                          :????:   .:~7???!.    ~???7Y&@#7777????7.
7???~    .7???7:      !!!!!!!!!!!!!!!    :????7!!77????7^     ~??775@@@GJJYJ?????7.
7???~     .!????^     7?????????????7.   :?????????7!~:      !????G@@@@@@@@5??????7:
::::.       :::::     :::::::::::::::    .::::::::..        .::::JGGGB@@@&7:::::::::
                                                                      ?@@#~
                                                                      P@B^
                                                                    :&G:
                                                                    !5.
                                                                    .Kubernetes Event-driven Autoscaling (KEDA) - Application autoscaling made simple.

Get started by deploying Scaled Objects to your cluster:
    - Information about Scaled Objects : https://keda.sh/docs/latest/concepts/
    - Samples: https://github.com/kedacore/samples

Get information about the deployed ScaledObjects:
  kubectl get scaledobject [--namespace <namespace>]

Get details about a deployed ScaledObject:
  kubectl describe scaledobject <scaled-object-name> [--namespace <namespace>]

Get information about the deployed ScaledObjects:
  kubectl get triggerauthentication [--namespace <namespace>]

Get details about a deployed ScaledObject:
  kubectl describe triggerauthentication <trigger-authentication-name> [--namespace <namespace>]

Get an overview of the Horizontal Pod Autoscalers (HPA) that KEDA is using behind the scenes:
  kubectl get hpa [--all-namespaces] [--namespace <namespace>]

Learn more about KEDA:
- Documentation: https://keda.sh/
- Support: https://keda.sh/support/
- File an issue: https://github.com/kedacore/keda/issues/new/choose

$ kubectl get crd | grep keda
cloudeventsources.eventing.keda.sh              2026-04-02T07:31:26Z
clustercloudeventsources.eventing.keda.sh       2026-04-02T07:31:26Z
clustertriggerauthentications.keda.sh           2026-04-02T07:31:26Z
scaledjobs.keda.sh                              2026-04-02T07:31:26Z
scaledobjects.keda.sh                           2026-04-02T07:31:26Z
triggerauthentications.keda.sh                  2026-04-02T07:31:26Z

$ kubectl get all -n keda
NAME                                                   READY   STATUS    RESTARTS      AGE
pod/keda-admission-webhooks-56b6b85c57-gc8sp           1/1     Running   0             45s
pod/keda-operator-5c65c9c598-np4h4                     1/1     Running   1 (36s ago)   45s
pod/keda-operator-metrics-apiserver-554cb87754-vskdq   1/1     Running   0             45s

NAME                                      TYPE        CLUSTER-IP       EXTERNAL-IP   PORT(S)             AGE
service/keda-admission-webhooks           ClusterIP   10.100.185.53    <none>        443/TCP,8020/TCP    46s
service/keda-operator                     ClusterIP   10.100.244.184   <none>        9666/TCP,8080/TCP   46s
service/keda-operator-metrics-apiserver   ClusterIP   10.100.208.233   <none>        443/TCP,9022/TCP    46s

NAME                                              READY   UP-TO-DATE   AVAILABLE   AGE
deployment.apps/keda-admission-webhooks           1/1     1            1           45s
deployment.apps/keda-operator                     1/1     1            1           45s
deployment.apps/keda-operator-metrics-apiserver   1/1     1            1           45s

NAME                                                         DESIRED   CURRENT   READY   AGE
replicaset.apps/keda-admission-webhooks-56b6b85c57           1         1         1       45s
replicaset.apps/keda-operator-5c65c9c598                     1         1         1       45s
replicaset.apps/keda-operator-metrics-apiserver-554cb87754   1         1         1       45s
배포는 되었으니 메트릭 서버에 KEDA 메트릭이 오는지 살펴봅시다.
$ k get pod -n keda -l app=keda-operator-metrics-apiserver
NAME                                               READY   STATUS    RESTARTS   AGE
keda-operator-metrics-apiserver-554cb87754-vskdq   1/1     Running   0          3m31s

$ k get --raw "/apis/external.metrics.k8s.io/v1beta1" | jq
{
  "kind": "APIResourceList",
  "apiVersion": "v1",
  "groupVersion": "external.metrics.k8s.io/v1beta1",
  "resources": [
    {
      "name": "externalmetrics",
      "singularName": "",
      "namespaced": true,
      "kind": "ExternalMetricValueList",
      "verbs": [
        "get"
      ]
    }
  ]
}
Deployment 생성 후 스케일 여부를 모니터링 해보기
php-apache 앱을 배포해보고 ScaledObject 정책을 생성합니다.
ScaledObject 예시값
apiVersion: keda.sh/v1alpha1
kind: ScaledObject
metadata:
name: php-apache-cron-scaled
spec:
minReplicaCount: 0
maxReplicaCount: 2 # Specifies the maximum number of replicas to scale up to (defaults to 100).
pollingInterval: 30 # Specifies how often KEDA should check for scaling events
cooldownPeriod: 300 # Specifies the cool-down period in seconds after a scaling event
scaleTargetRef: # Identifies the Kubernetes deployment or other resource that should be scaled.
apiVersion: apps/v1
kind: Deployment
name: php-apache
triggers: # Defines the specific configuration for your chosen scaler, including any required parameters or settings
- type: cron
metadata:
timezone: Asia/Seoul
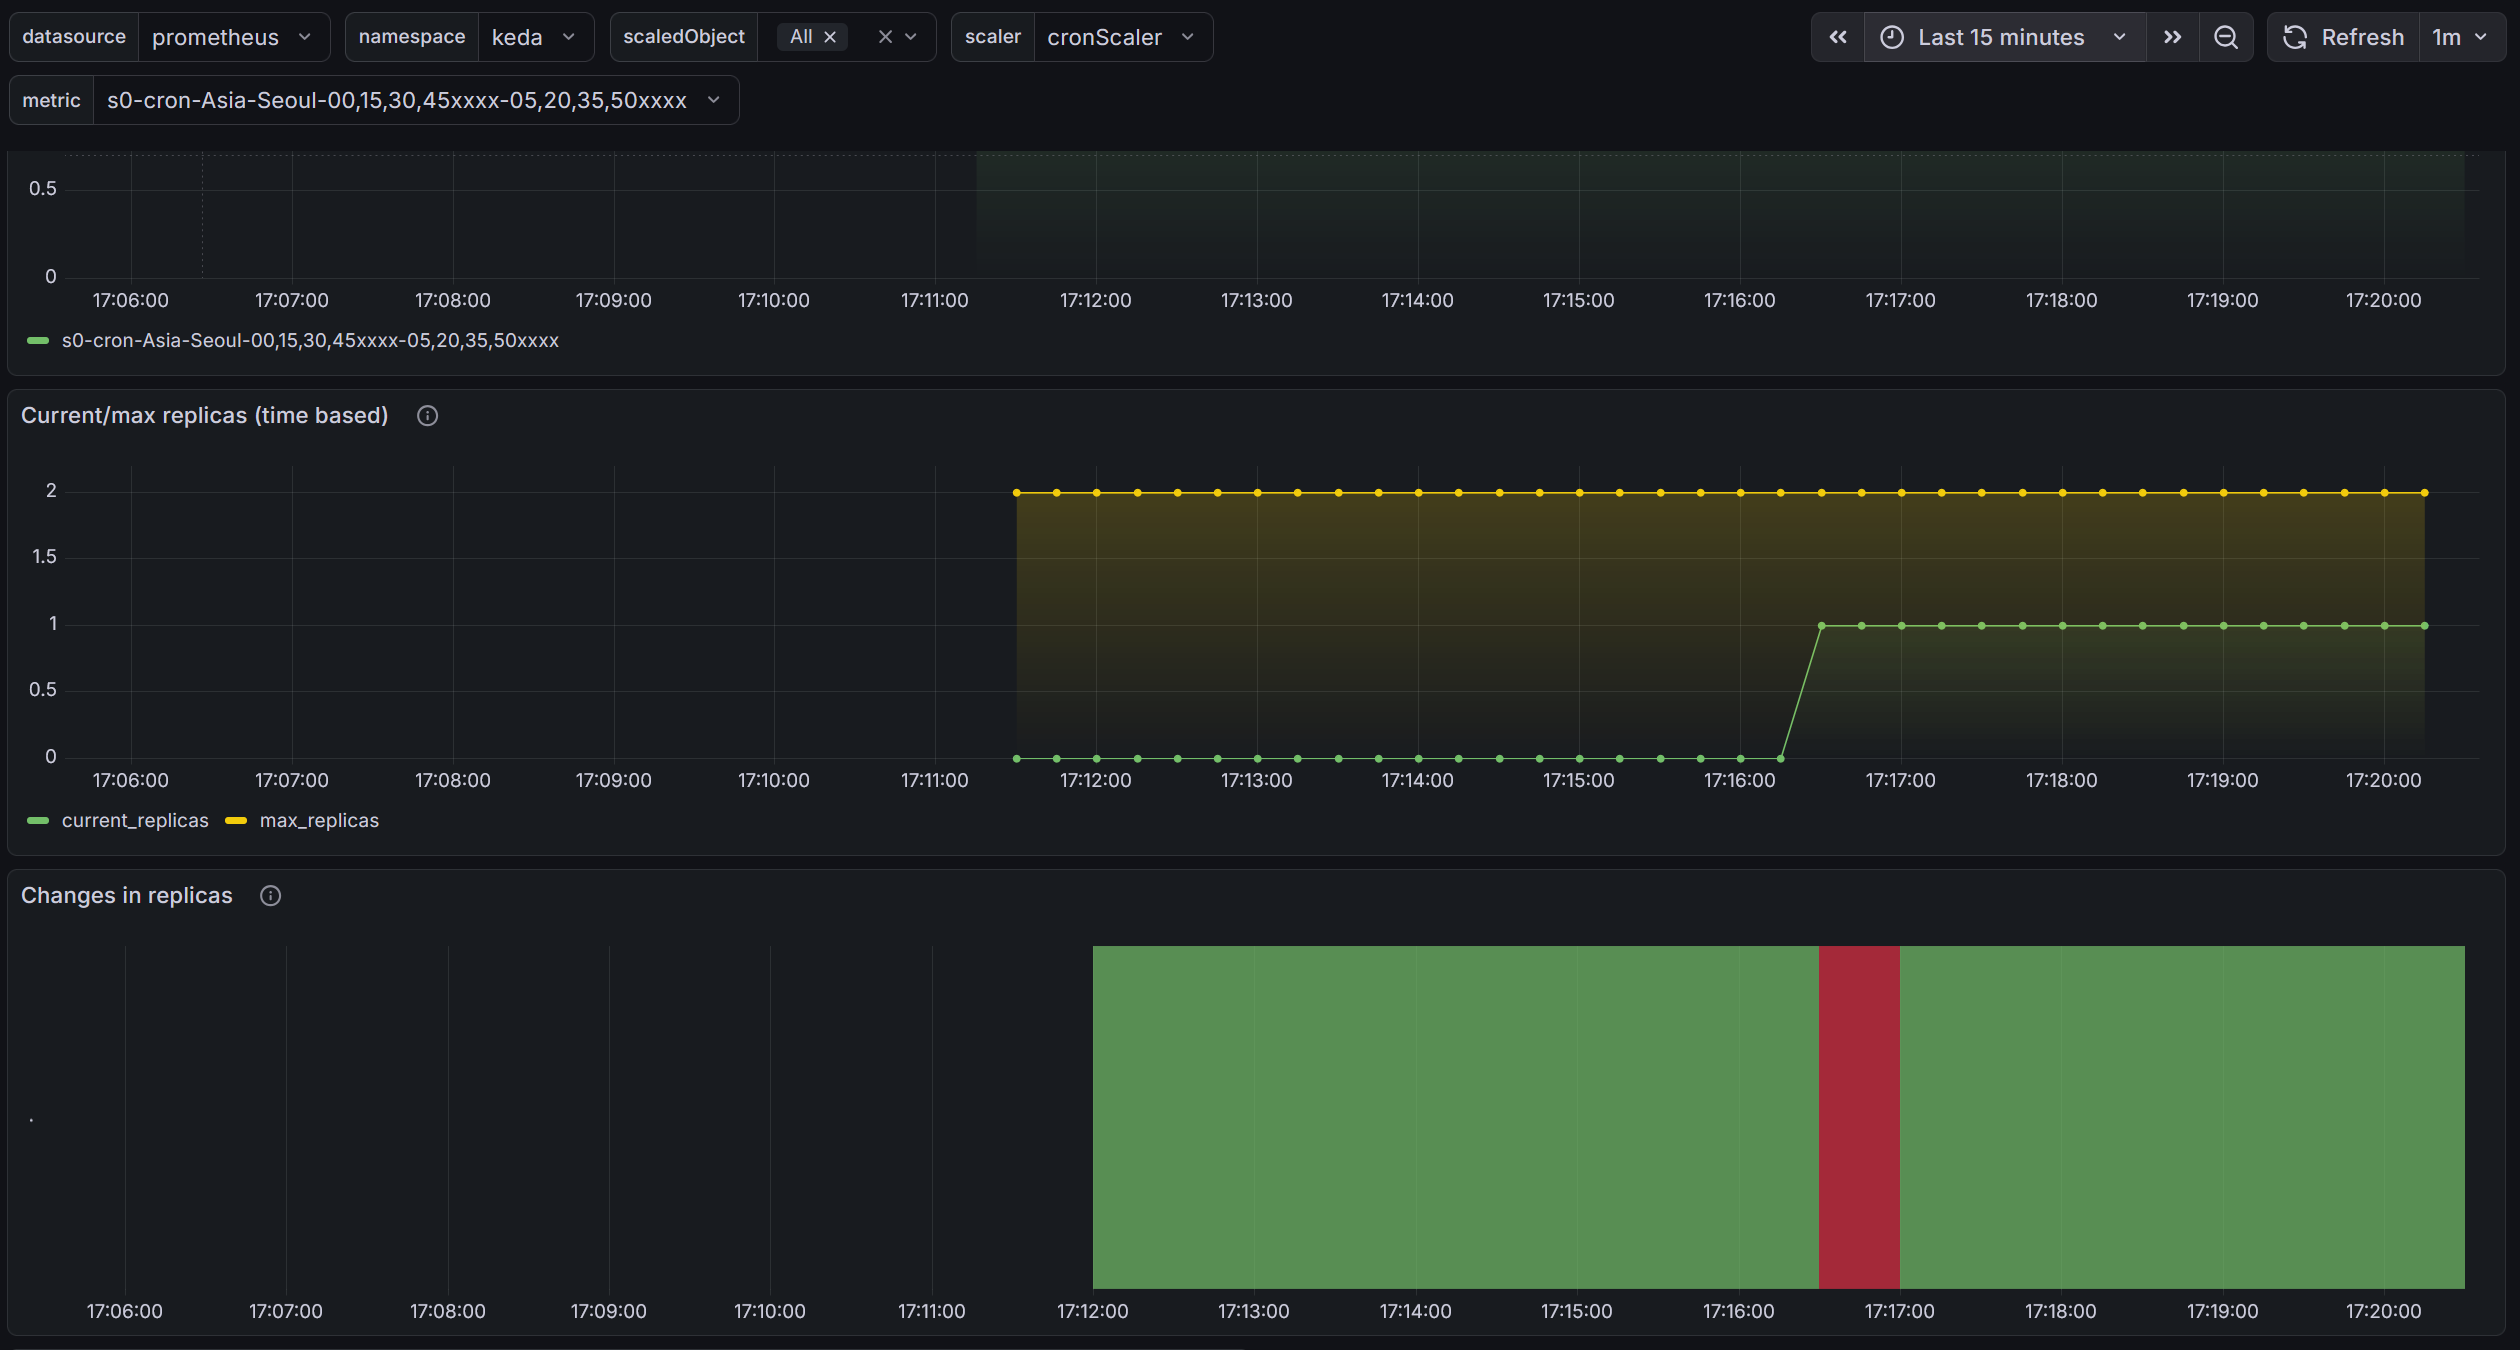
start: 00,15,30,45 * * * *
end: 05,20,35,50 * * * *
desiredReplicas: "1"
배포를 진행합니다.
$ k apply -f keda-cron.yaml -n keda
scaledobject.keda.sh/php-apache-cron-scaled created

# 설정상 15분마다 cron으로 구동되었음을 볼 수 있습니다.
$ k describe scaledobject php-apache-cron-scaled -n keda
Events:
  Type     Reason                    Age                 From           Message
  ----     ------                    ----                ----           -------
  Warning  ScaledObjectCheckFailed   29m (x12 over 29m)  keda-operator  ScaledObject doesn't have correct scaleTargetRef specification
  Warning  ScaledObjectCheckFailed   18m (x18 over 29m)  keda-operator  Target resource doesn't exist
  Normal   KEDAScalersStarted        7m24s               keda-operator  Scaler cron is built.
  Normal   KEDAScalersStarted        7m24s               keda-operator  Started scalers watch
  Normal   KEDAScaleTargetActivated  3m24s               keda-operator  Scaled apps/v1.Deployment keda/php-apache from 0 to 1, triggered by cronScaler

$ k get hpa -o jsonpath="{.items[0].spec}" -n keda | jq
{
  "maxReplicas": 2,
  "metrics": [
    {
      "external": {
        "metric": {
          "name": "s0-cron-Asia-Seoul-00,15,30,45xxxx-05,20,35,50xxxx",
          "selector": {
            "matchLabels": {
              "scaledobject.keda.sh/name": "php-apache-cron-scaled"
            }
          }
        },
        "target": {
          "averageValue": "1",
          "type": "AverageValue"
        }
      },
      "type": "External"
    }
  ],
  "minReplicas": 1,
  "scaleTargetRef": {
    "apiVersion": "apps/v1",
    "kind": "Deployment",
    "name": "php-apache"
  }
}
앞서 작성한 그라파나로 살펴보면 이런식으로 확인이 가능합니다.
CPA - Cluster Proportional Autoscaler
CPA란?
노드 수(또는 코어 수)에 비례하여 특정 애플리케이션의 Pod 수를 자동 조정하는 오토스케일러입니다. - Github Workshop
HPA/KEDA와 달리 메트릭을 보는 게 아니라, 클러스터 규모 자체를 기준으로 삼습니다.
대표적인 사용 사례는 CoreDNS입니다. 노드가 늘어나면 DNS 쿼리도 비례해서 증가하므로, CoreDNS Pod도 함께 늘려야 합니다.
스케일링 정책 — Ladder
nodesToReplicas로 "노드 N개일 때 Pod M개" 매핑 테이블을 정의합니다.
config:
  ladder:
    nodesToReplicas:
      - [1, 1] # 노드 1개 → Pod 1개
      - [2, 2] # 노드 2개 → Pod 2개
      - [3, 3] # 노드 3개 → Pod 3개
      - [4, 3] # 노드 4개 → Pod 3개 (유지)
      - [5, 5] # 노드 5개 → Pod 5개
노드 수 대신 CPU 코어 수 기반 정책도 가능합니다.
config:
  ladder:
    coresToReplicas:
      - [1, 1]
      - [64, 3]
      - [512, 5]
      - [1024, 7]
      - [2048, 10]
      - [4096, 15]
실습
CPA 설치
helm repo add cluster-proportional-autoscaler https://kubernetes-sigs.github.io/cluster-proportional-autoscaler
helm upgrade --install cluster-proportional-autoscaler cluster-proportional-autoscaler/cluster-proportional-autoscaler
테스트용 nginx 배포
cat <<EOF > cpa-nginx.yaml
apiVersion: apps/v1
kind: Deployment
metadata:
  name: nginx-deployment
spec:
  replicas: 1
  selector:
    matchLabels:
      app: nginx
  template:
    metadata:
      labels:
        app: nginx
    spec:
      containers:
      - name: nginx
        image: nginx:latest
        resources:
          limits:
            cpu: "100m"
            memory: "64Mi"
          requests:
            cpu: "100m"
            memory: "64Mi"
        ports:
        - containerPort: 80
EOF
kubectl apply -f cpa-nginx.yaml
CPA 규칙 적용
cat <<EOF > cpa-values.yaml
config:
  ladder:
    nodesToReplicas:
      - [1, 1]
      - [2, 2]
      - [3, 3]
      - [4, 3]
      - [5, 5]
options:
  namespace: default
  target: "deployment/nginx-deployment"
EOF

helm upgrade --install cluster-proportional-autoscaler \
  -f cpa-values.yaml \
  cluster-proportional-autoscaler/cluster-proportional-autoscaler
노드 수 변경 → Pod 수 자동 조정 확인
# 모니터링
watch -d kubectl get pod

# 노드 5개로 증가 → nginx Pod가 5개로 늘어나는지 확인
export ASG_NAME=$(aws autoscaling describe-auto-scaling-groups \
  --query "AutoScalingGroups[? Tags[? (Key=='eks:cluster-name') && Value=='myeks']].AutoScalingGroupName" \
  --output text)
aws autoscaling update-auto-scaling-group \
  --auto-scaling-group-name ${ASG_NAME} \
  --min-size 5 --desired-capacity 5 --max-size 5

# 노드 4개로 축소 → nginx Pod가 3개로 줄어나는지 확인
aws autoscaling update-auto-scaling-group \
  --auto-scaling-group-name ${ASG_NAME} \
  --min-size 4 --desired-capacity 4 --max-size 4
정리
helm uninstall cluster-proportional-autoscaler && kubectl delete -f cpa-nginx.yaml